
The phenomenon of choked flow is often encountered in gas piping systems and tends to occur where there is a change in the flow path cross-sectional area. It can, therefore, occur in locations where we have orifice plates, valves, and fittings. It can however, also occur as flow exits a pipe into a vessel or to atmosphere.
Sonic choking is experienced in pipelines where the flowing gas reaches a velocity which is equal to the local sonic velocity of the gas at that given temperature and pressure. The gas, therefore, attempts to accelerate beyond the local sonic velocity and therefore becomes limited or choked.
If we consider air flow systems, choking typically occurs when the downstream absolute pressure (P2) is 52.8% of the upstream absolute pressure (P1), i.e. the absolute pressure ratio is 0.528.
Let’s initially consider a scenario where we have air flowing through a 10M long 2-inch pipeline with an inlet and outlet pressure of 6 & 5 bar a respectively. The air in the pipe stream must expand due to the pressure loss in the line. This results in a reduction in air density which tends to increase the fluid velocity and as such, the actual volumetric flow rate in the system. See Figure 1 below for details.
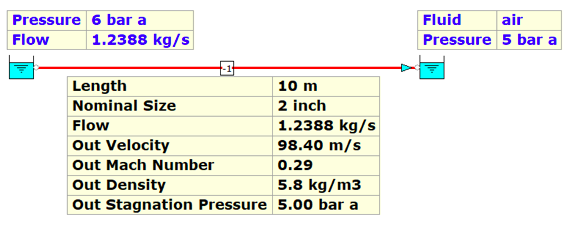
Figure 1: Air Flow System.
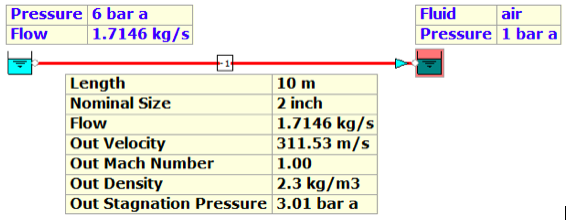
If we gradually decrease the downstream pressure we can reach the choke point for the system. Based on our rule of thumb, this should occur when the outlet pressure is in the region of approximately 3.168 bar a. Let’s recalculate the system based on an arbitrary outlet pressure of 2.0 bar a.
In Figure 2, we can see the result of this design scenario. FluidFlow has automatically detected endpoint choking conditions in the pipeline.
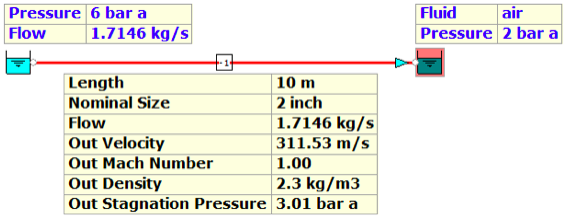
Figure 2: Choked Flow with Outlet Pressure 2.0 bar a.
We can see from Figure 2 that the Mach number is 1.0 and the mass flow rate is 1.7146kg/s. Let’s see what happens when we reduce the outlet pressure even further to 1.0 bar a.
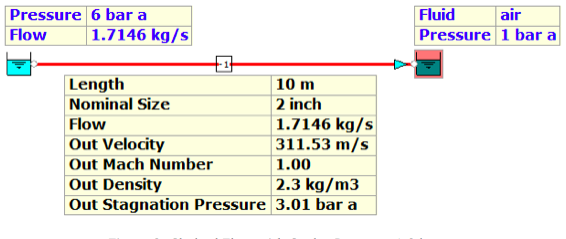 Figure 3: Choked Flow with Outlet Pressure 1.0 bar a.
As we can see, the mass flow is unchanged as it has become choked in this system.
FluidFlow automatically detects choked flow and also plots the resistance, density, static pressure, static temperature & velocity curves for all pipes. Figure 4 provides an illustration of the density curve for the pipe in Figure 3.
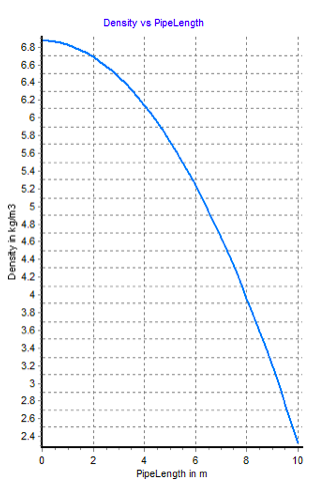
Figure 4: Density vs Pipe Length Curve.
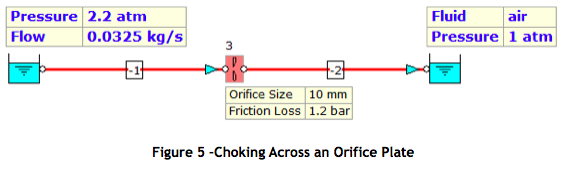
Figure 5 illustrates how FluidFlow detects choking conditions across a size-change component such as an orifice plate. In this case, we have an inlet and outlet pressure in a 10.0M 2 inch pipeline of 2.2 and 1 atm respectively. The orifice diameter is only 10mm. The pressure loss across the orifice plate is quite high at 1.2 bar. As a result, the air must accelerate to satisfy the continuity equations. In this case, the gas attempts to accelerate beyond the local sonic velocity causing choked flow.

Why choose the FluidFlow Gas Module ?
FluidFlow does not assume gas ideality but solves for real gas conditions. The software will solve complex systems including gas mixtures (by mole or mass %). FluidFlow is provided with heat transfer functionality and a comprehensive database of fluids and components as standard.