Control Valve Sizing. The successful operation of process plant and systems involves the highest level of measurement and control performance. Control valves therefore perform a key function in this process. The performance of control valves can have a dramatic effect on plant operating efficiency, overall profitability and asset life cycle costs.
A correctly sized control valve can provide significant quantifiable savings as well as increase process availability, reduce process variability and reduce maintenance costs. Correctly sized control valves also last longer in comparison to unmatched or incorrectly sized valves. Careful consideration should therefore be given to the correct sizing of system control valves.
The Importance of Sizing
Control valve sizing procedures are based on accepted mathematical methods such as those detailed in ISA-75.01.01-2007 – Flow Equations for Sizing Control Valves. These methods can be used to develop accurate valve sizes however, during the course of plant design, control valves are often sized based on a future maximum design process load plus a safety factor. This can result in the specification, procurement and maintenance of a larger valve than necessary thus producing imprecise control, poor production performance in addition to the operational issues discussed above.
When sizing a control valve, the most common approach is to calculate the flow coefficient, Cv which is a measure of the capacity of the valve body and trim. A valve Cv can be described as the number of gallons per minute (GPM) at 60oF (15.5oC) that will pass through a valve with an associated pressure drop of 1 psi. In simple terms, a fully open control valve with a Cv of 14 usgpm/psi passes 14 usgpm of fluid with 1 psi pressure drop. The flow coefficient is discussed in further detail below.
Flow Coefficient (Cv)
The flow coefficient or valve coefficient denoted by “Cv”, is used to determine the valve size that will best allow the valve to pass the required flow rate while providing stable control of the process fluid. Most valve manufacturers publish Cv data in product catalogues for various valve styles. Table 1 provides an example of an equal percentage valve curve characteristic as published by Crane Engineering.

Table 1: Equal Percentage Characteristic Curve Co-ordinates
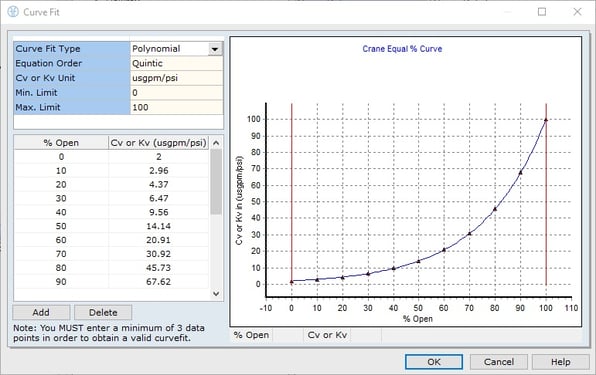
The performance curve for the tabulated co-ordinates is shown in Figure 1.
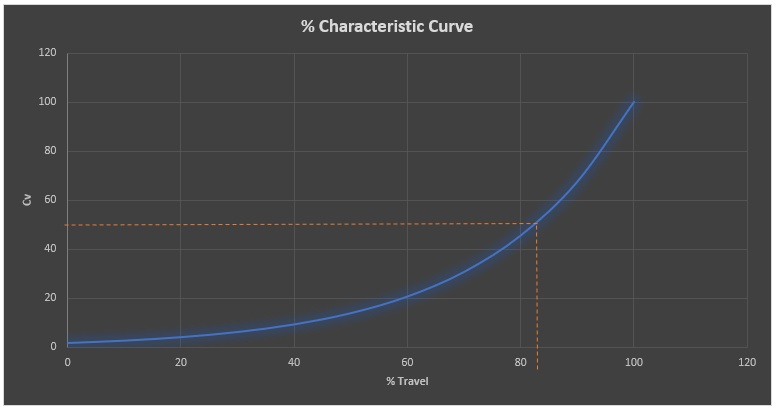
Figure 1: Equal Percentage Characteristic Curve
Crane Engineering noted a value of 50% capacity at 82.3% travel which is denoted by the dashed line in the capacity curve.
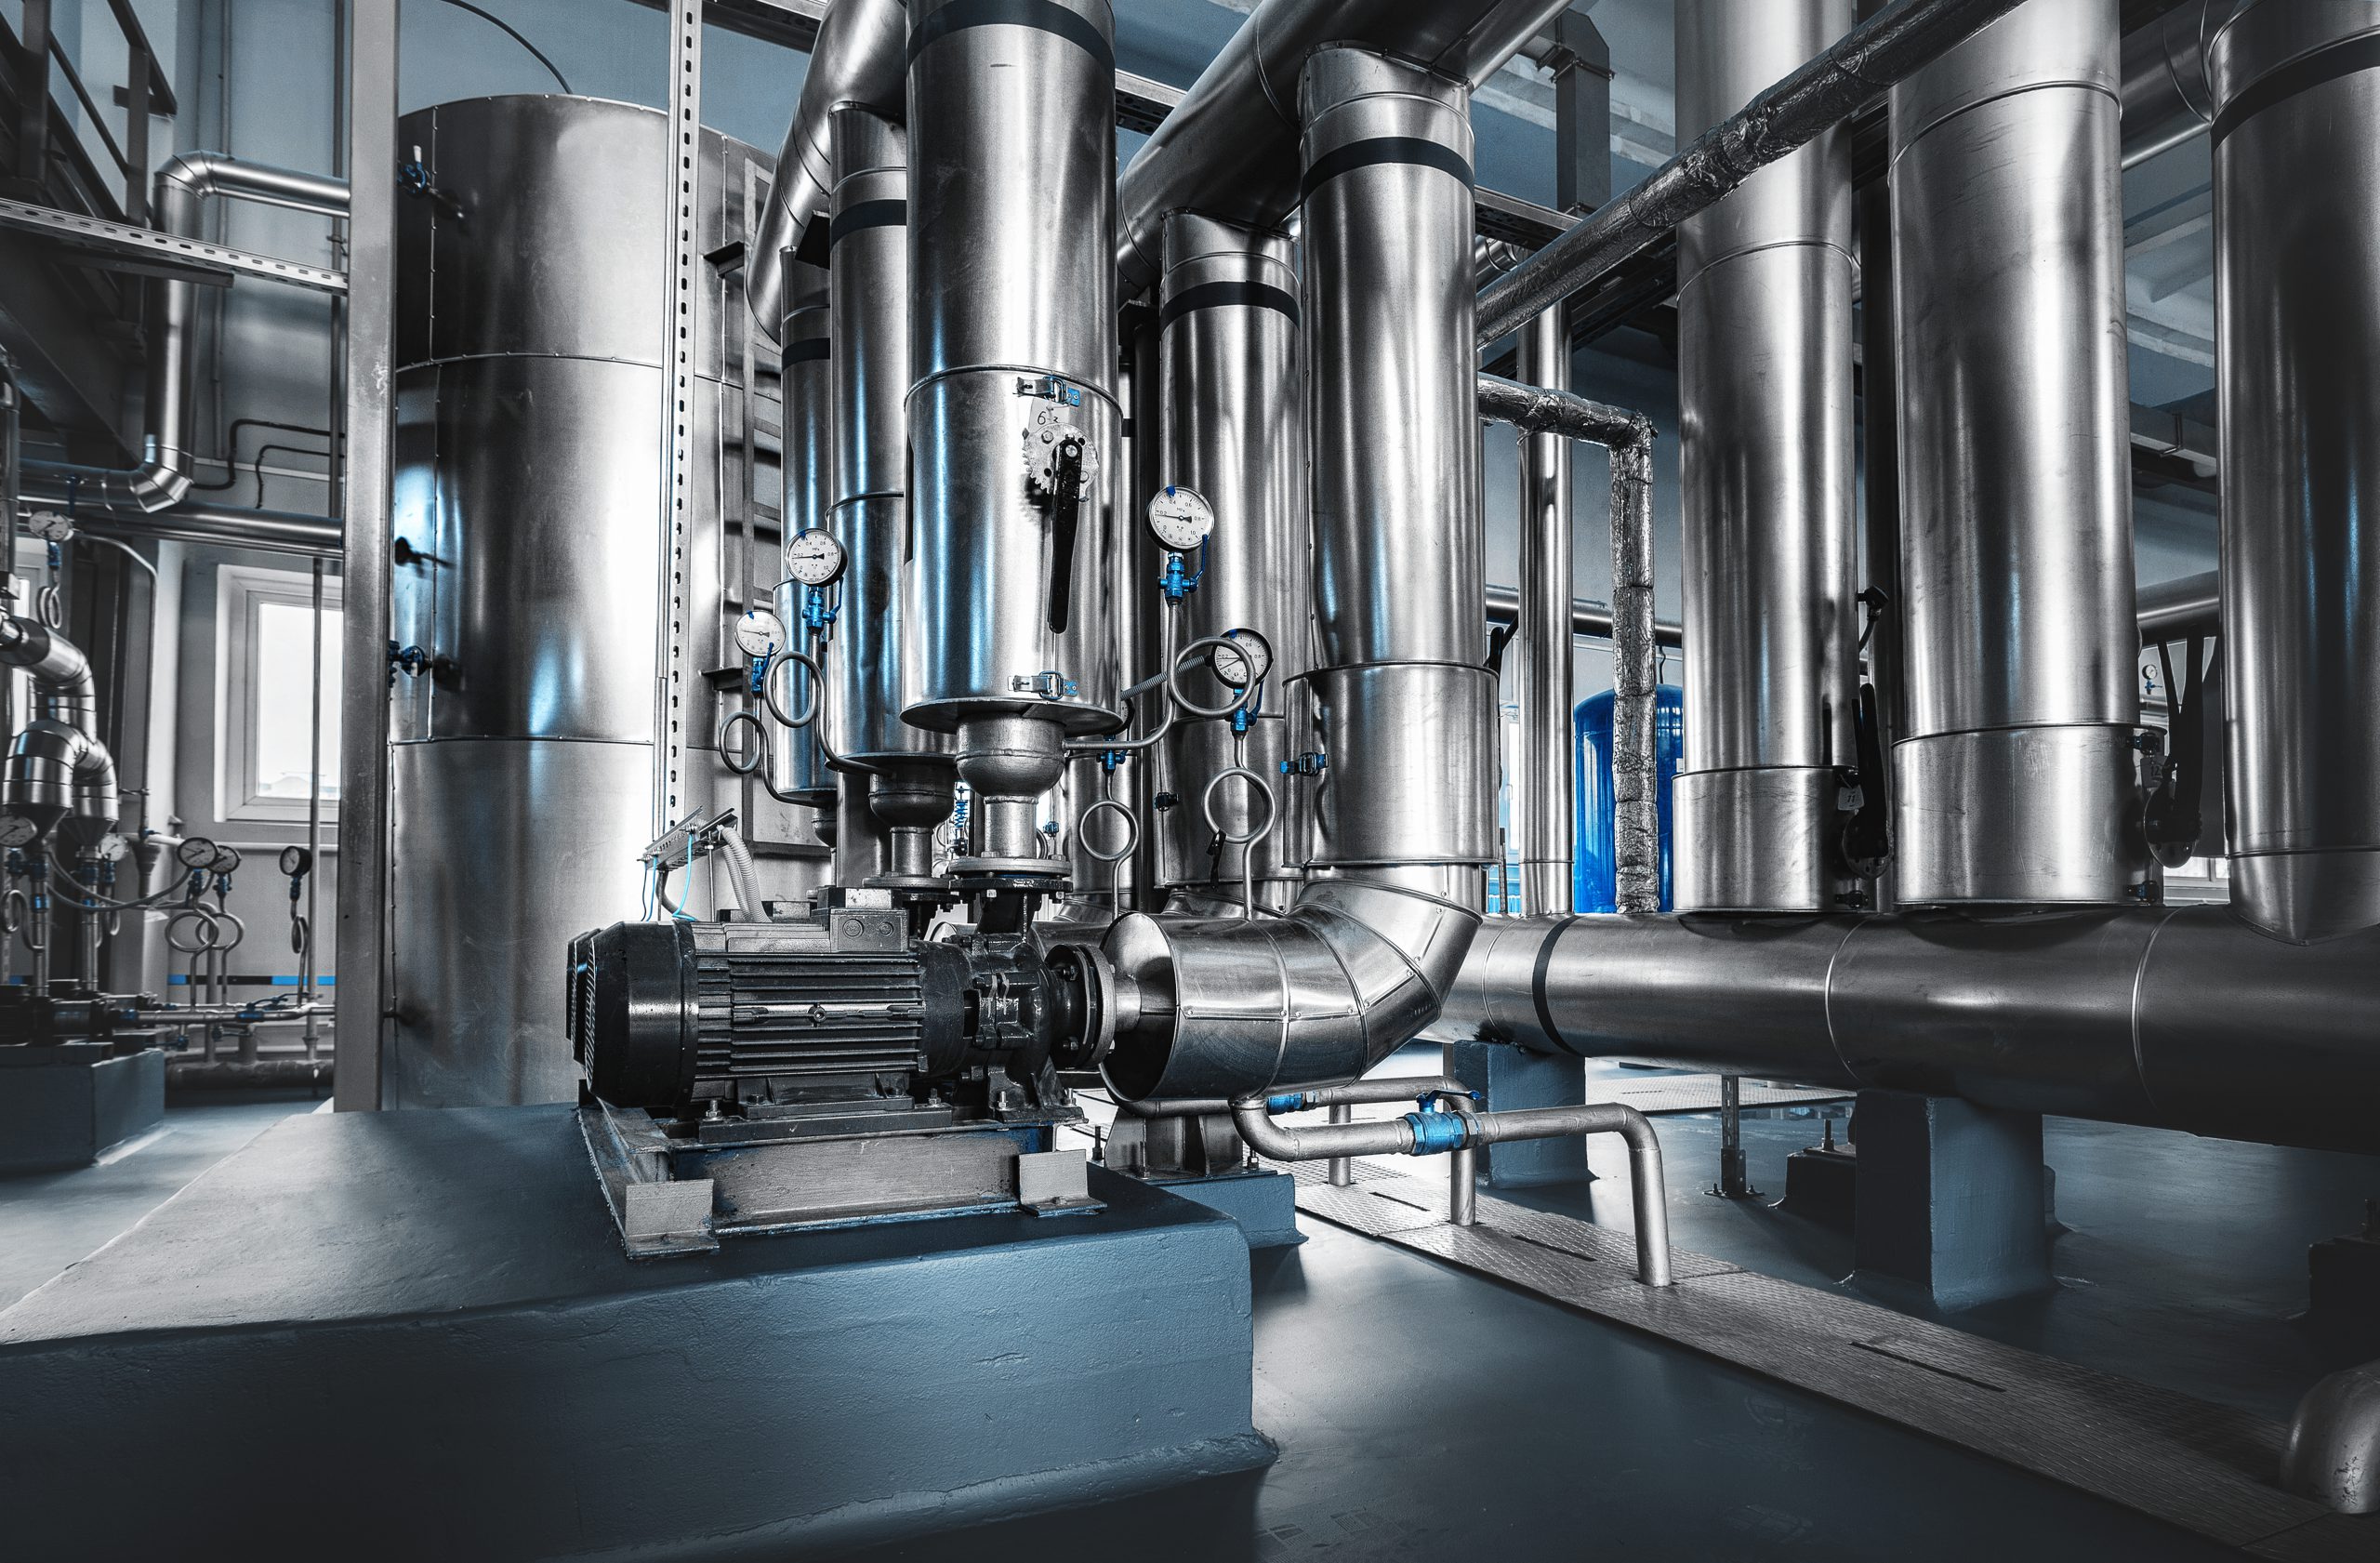
The tabulated coordinates for this performance curve have been defined in the FluidFlow control valve database. The control valve performance curve is automatically generated by the software and can be viewed in Figure 2.
Figure 2: Control Valve Performance Curve (FluidFlow)
In an attempt to make a comparison with the Crane Engineering data, a test-case piping system was created in FluidFlow piping system software (Figure 3).
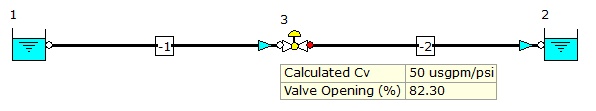
Figure 3: Crane Equal Percentage Control Valve Modeled in FluidFlow Software.
The control valve has been modeled in the above liquid flow system whereby the duty point is near the Crane Engineering case, 50% capacity at 82.3% travel. As shown in Figure 3, the calculated FluidFlow result matches exactly with the Crane Engineering example.
If the Cv for a control valve is not calculated correctly or accurately, the resultant selected valve will experience diminished performance. If the Cv is too small for the process, the valve itself or the trim inside the valve will be undersized resulting in the system being “starved” of the process fluid. Undersized valves exhibit a higher pressure drop across the valve to maintain adequate flow and exhibit limited flow capacity. Furthermore, since the restriction in the valve can cause a build-up of upstream pressure, higher back pressures created before the valve can lead to damage in upstream pumps or other upstream equipment. Although relatively uncommon, an undersized control valve generally cannot deliver sufficient flow rates under maximum load conditions.
If the Cv calculated is too high for the system requirements, the result is a larger oversized control valve is usually selected. In addition to the more obvious issues with an oversized valve such as a larger cost, weight and size, when in throttling service, significant control instability can occur. Usually the closure element, such as the valve plug or disk, is positioned just off the valve seat which leads to higher pressure drops across the valve and higher fluid velocities which can cause cavitation, flashing or erosion of the valve trim elements.
Cavitation can occur in liquid systems when high velocity reduces the static pressure inside the valve to below the pressure level at which the liquid stats to boil and produce vapor bubbles. These vapor bubbles collapse whenever the downstream pressure is higher than the vapor pressure causing high pressure waves. These implosions result in very high noise levels and can cause considerable damage to the valve body or trim parts under prolonged service.
Oversized control valves are quite common and are highly sensitive to operating conditions with even the smallest of adjustments in valve position causing significant changes in fluid flow rate. It is therefore extremely difficult to achieve the exact flow rate required under these conditions. Oversizing of control valves can also have a domino effect. Safety relief valves must be sized to match the capacity of the control valve. Within bypass configurations, isolation valves, bypass valves and drain valves must all be larger which can impact on the size of the piping and associated structural supports.
The most common and basic form of the equation for liquid applications is;
Q*sqrt(SG/(P1-P2))
Where;
Cv is the Flow Coefficient which describes how much fluid will flow (GPM) through the valve for a given pressure drop of 1 psi.
Q is the Flow Rate (GPM).
P1 is the Upstream Pressure (psi).
P2 is the Downstream Pressure (psi).
SG is the liquid specific gravity.
The ISA-75.01.01-2007 standard includes equations for predicting the flow coefficient of compressible and incompressible fluids through control valves. The standard uses the following flow sizing equation for Newtonian liquid flow;
C = Q/N1 * √ (ρ1/ρ0) / (∆P)
Where;
C is the Flow Coefficient which describes how much fluid will flow through the valve for a given pressure drop.
Q is the Flow Rate (m3/h, GPM, SCFH).
∆P is the differential pressure between upstream and downstream pressure taps (kPa, bar, psi).
ρ1/ρ0 is the relative density.
N1 is the numerical units constant (Refer to Table 1 in ISA-75.01.01-2007 standard).
These equations are widely accepted for sizing valves in liquid flow systems.
Note, the equations detailed in the ISA-75.01.01-2007 standard enable the control valve size to be determined in absence of any connected piping and fittings. An even better solution is to apply these equations whilst also including the interactions of the pipework and fittings in a full connected piping system. This will provide a much more accurate solution and provide a baseline for correct valve selection.
Control Valve Sizing – Rules of Thumb
When sizing control valves, a general rule of thumb noted in many engineering publications is to size the valve such that it operates between 20 to 80% open at maximum required flow rate. It is also recommended to have the minimum opening no less than 20% to provide a safety margin at the minimum flow rate required. This approach ensures that as much of the valves control range as possible is used while maintaining a reasonable (but not excessive) safety margin.
As a guide, correctly sized globe valves are typically one size smaller than the line size and properly sized butterfly, full-ball and segment-ball valves are typically two sizes smaller than the line size. Note, this statement should be used as an indicative guide only and not as design criteria or a design rule. Furthermore, this guide only serves as a useful rule of thumb if the connected lines have been sized accurately and correctly.
Control Valve Sizing Example
The ISA-75.01.01-2007 standard provides an example liquid case which is summarised as follows;
Fluid: Water.
Inlet Temperature: 363K.
Fluid Density: 965.4 kg/m3.
Inlet Absolute Pressure: 680 kPa.
Outlet Absolute Pressure: 220 kPa.
Flow Rate (Q): 360 m3/h.
Pipe Size: 150mm.
Solution:
C = Q/N1 * √ (ρ1/ρ0) / (∆P)
C = 165 m3/h/bar for Kv
Modeling this scenario yields the following results.
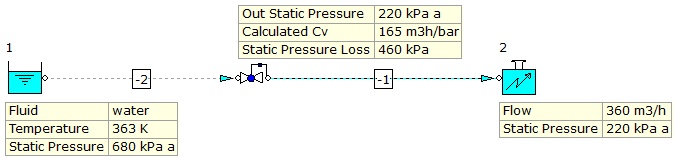
Figure 4: ISA Liquid Control Valve Sizing Example.
The control valve in this example has been automatically sized using FluidFlow software based on the design conditions presented. The modeled case provides a C or Kv of 165 m3/h/bar which matches the ISA-75.01.01-2007 example.
Energy Saving Opportunities
Control valve inefficiencies in plant processes offer opportunities for energy savings and reduced maintenance costs. Valves which consume a large fraction of the total pressure drop for the system or are excessively throttled can present considerable opportunities for energy savings. Pressure drops in liquid systems increase the energy requirements of these systems. Pressure drops are caused by resistance or friction in piping and in pipe bends, joints etc as well as throttled control valves. The power required to overcome the pressure drop is proportional to both the fluid flow rate and magnitude of the pressure drop. If the valve is oversized, the valve will be throttled excessively and also, if the valve is undersized, the pressure drop will be unnecessarily excessive which of course, can increase pump energy requirements significantly. Control valves should therefore be carefully sized and selected.
There is also scope for energy savings in existing systems featuring control valves. When reviewing design control valve sizes, it is important to understand the causes of any valve sizing errors. Emerson research previously identified several major contributing factors to valve sizing errors. These include selecting line-size valves, out of date process data resulting from changes in process conditions or operating conditions which differ to the original system design. To correct systems with incorrect valve sizes, its essential to obtain accurate process data at all expected operating conditions. The control valve can then be sized correctly.
Conclusion
The process of “control valve sizing” is a procedure where the dynamics of the system are matched to the performance characteristics of the valve. This produces a control valve of an appropriate size and type that will best meet the needs of managing flow within the process system. Every attempt should be made to carefully and accurately size and select a control valve for the required application. The topic of control valve selection will be discussed in a separate blog.
This discussion attempts to outline only the basics of control valve sizing. Further detailed reading is recommended when completing control valve sizing for liquid or even gas flow systems along with consideration of other design factors which should be considered as part of the sizing process such as Liquid Pressure Recovery Factor (FL), etc.
Note, FluidFlow solves the various forms of the equations described in ISA-75.01.01-2007, taking into account Liquid Pressure Recovery Factor (FL) etc.

References:
An Insider’s Guide to Valve Sizing & Selection by Jon F. Monsen.
ISA-75.01.01-2007 Flow Equations for Sizing Control Valves.
Valve Handbook, Philip L. Skousen.
The Definitive Guide to Control Valves, Crane Engineering.
www.chemicalprocessing.com