
We are all fairly familiar with the performance curves for centrifugal pumps but what may not be so obvious is the extremely important relationship between the actual duty-point on the pump curve and the resultant pump reliability. Overlooking this relationship can result in reduced equipment lifespan, higher maintenance costs and quite costly pump repairs not to mention the headaches and associated costs that can arise from unexpected and preventable equipment downtime.
Centrifugal pumps should be selected to operate as close to the best efficiency point (BEP) as possible. But what is the BEP? The best efficient point represents the duty point on the pump performance curves where the highest level of operating efficiency is achieved for a given impeller diameter. In an ideal scenario, a centrifugal pump would operate at or as close to the BEP as possible at all times however, fluctuating demand profiles and system upsets are common causes for the actual duty point to move to/from the BEP.
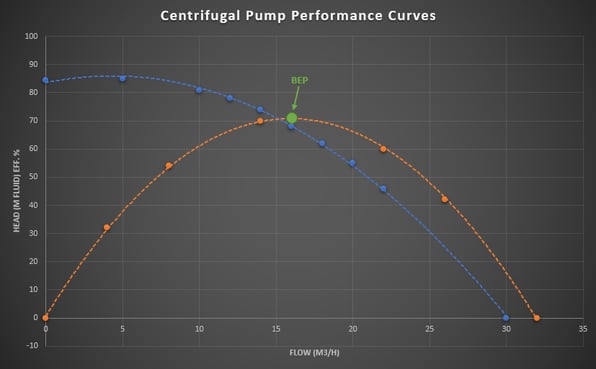
Let’s consider the performance curves for a sample centrifugal pump as shown in Figure 1. The BEP is denoted by the green duty-point, i.e. the apex of the efficiency curve. Therefore, if this specific pump was operating in a system whereby the duty-point on the pump capacity curve was 16 m3/h with a head requirement of 68 m fluid, the pump would be operating at the BEP (71 %) and therefore exhibiting the highest level of operating efficiency for the given impeller diameter on which these performance curves are based, in this case 160mm.
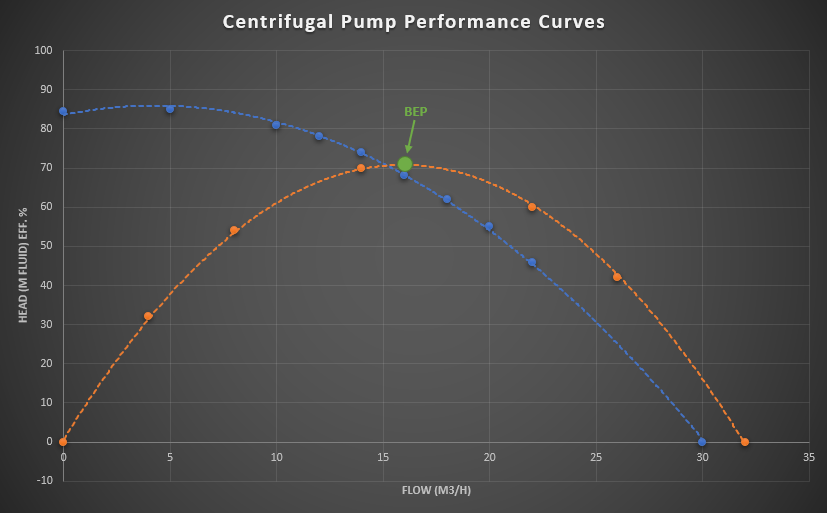
Figure 1: Centrifugal Pump Performance Curves.
Let’s consider the operating condition in this example of 16 m3/h @ 68 m fluid as our ideal duty-point or operating condition. If the flow rate in the system fluctuates, then so too will the duty point on the performance curves. For instance, operating at a higher flow rate than the BEP will result in the duty point on the performance curves moving to the right of the BEP. Likewise, operating at a lower flow rate than the BEP will result in the duty point on the performance curves moving to the left of the BEP. The key point in both scenarios is that the duty point moves away from the BEP which of course is away from the apex of the efficiency curve and as such, reduces the overall operating efficiency of the pump. This will result in increased energy costs which are sometimes considered “insignificant” unless the pump operates under these conditions for extended time-periods or has a large horsepower motor.
In real-world scenarios, it is generally not possible to operate exactly at the BEP at all times. However, if the pump can be sized and selected to operate within an optimum operating range of the BEP, the efficiency and pump reliability can be maximised. Some literature sources in the public domain quote a range of 70 to 120 % or 80 to 120 % of the BEP.
It is generally considered that a centrifugal pump should be sized and selected to operate within the range of +/-10% of the BEP. This should serve as a useful guide for pump selection.
Figure 2 outlines the ideal operating range for this specific sample pump based on +/- 10% of the BEP (14.4 to 17.6 m3/h).
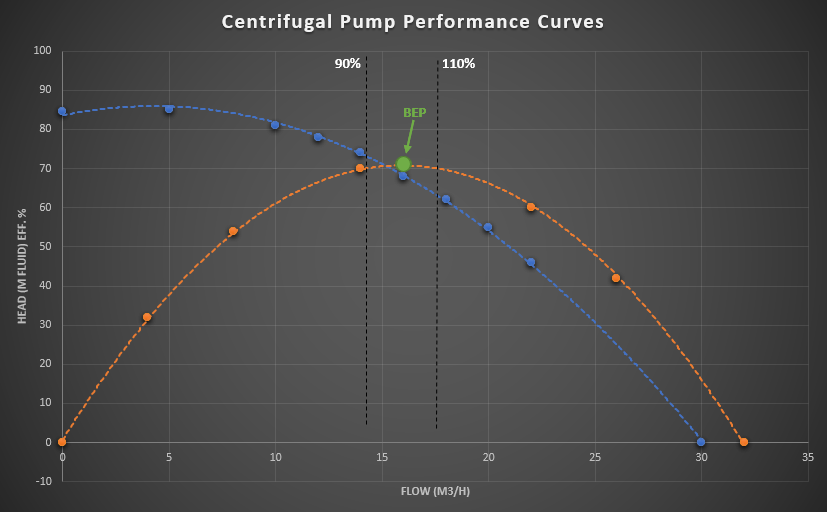
Figure 2: Ideal Operating Range of Centrifugal Pumps.
So, we have discussed the general effects of operating away from the BEP but what are the ultimate effects on the pump as we operate further away from the BEP operating range. Figure 3 gives an overview of the conditions which arise when a centrifugal pump operates further away from the BEP for an extended period of time. This is true for incorrectly sized or poorly matched pumps.
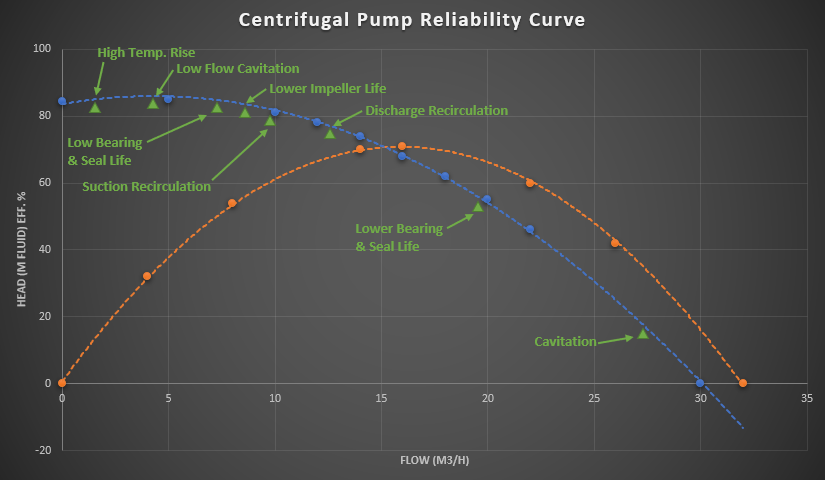
Figure 3: Ideal Operating Range of Centrifugal Pumps
Figure 3 demonstrates that the pump will encounter cavitation, elevated temperatures, lower bearing and seal life etc. The pump will also experience excessive vibration, potential lubricant breakdown, accelerated wear on components such as shafts, bearings and impellers.
Note, suitable software tools can help with the correct sizing and selection of pumps. Figure 4 shows the performance curves for a vendor pump on the left-hand side. This pump data was then modeled in a sample test-case system in FluidFlow. When using FluidFlow, we can see where the system curve intersects the pump capacity curve and the actual duty point on the performance curves. The calculated results for the pump allow us to see the operating efficiency, NPSHa, NPSHr as well as the duty head requirement. This data helps us select a pump best suited to the system. Changes in pump speed and impeller diameter can also be considered as well as the effect of fluctuating demand on the system.
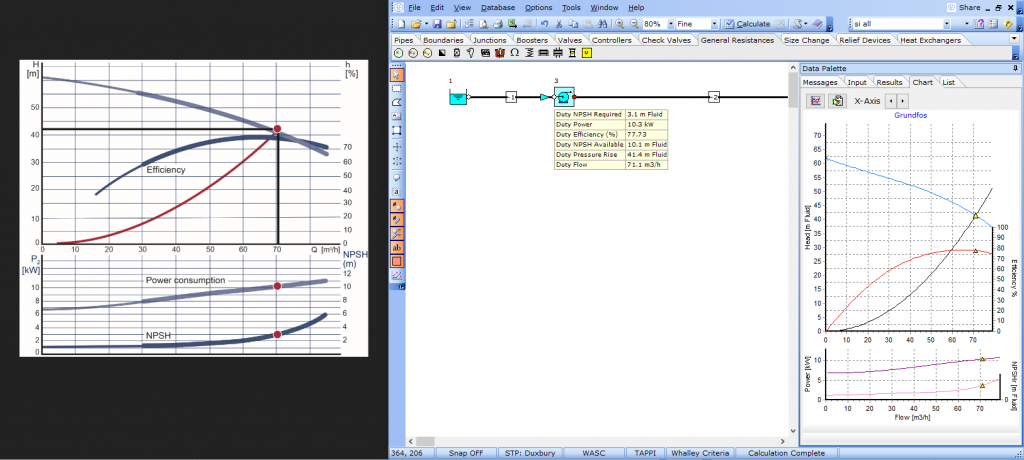
Figure 4: Modeling Centrifugal Pumps in FluidFlow.
FluidFlow includes powerful pump and equipment sizing functionality which helps simplify the design process of sizing pipes, control valves, relief valves, orifice plates, pumps etc. Perhaps more importantly, this feature is proven to drastically reduce required design time on projects meaning designers can use their time more effectively as well as have confidence in the pumps and equipment sized and selected for the system under design.