
A previous blog post considered the applicability or the ideal gas equations for gas flow modelling and the potential pitfalls of using such a solution approach. This post considers a number of simple natural gas pipe flow systems which have been solved using FluidFlow. FluidFlow software doesn’t make simplifying assumptions and solves for real gas flow conditions using an equation of state.
Figure 1 provides an illustration of a horizontal natural gas pipe line consisting of 50 miles of 26 in OD pipe having an ID of 25.44 in. The temperature of the flowing gas is 60 F. The upstream and downstream pressures are 825 and 565 psia respectively.
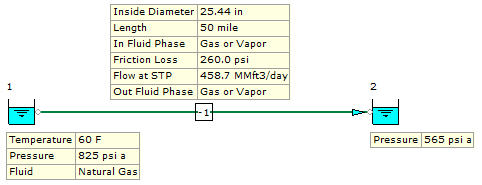
Figure 1: Modeling Horizontal Flow of Natural Gas.
The solution in Figure 1 shows good agreement with published literature (1) where Q was estimated by way of a hand-calculation to be 462 MMft3/day at 14.65 psia (101008 Pa) and 60 F (15.5 oC). FluidFlow has established a flow rate of 458. 7 MMft3/day. The difference in flow can be attributed to the difference in density of the flowing gas and reference volumetric flow conditions, i.e. a 101325 Pa and 15 oC.
Figure 2 provides an overview of a gas-distillate well pressure model where the inlet pressure has been calculated. The vertical pipe length is 5790 ft with a corresponding well depth of 5790 ft. The pipe ID is 1.995 in with an inlet flow rate of 5.153 MMft3/day (STP) and temperature of 83 F.
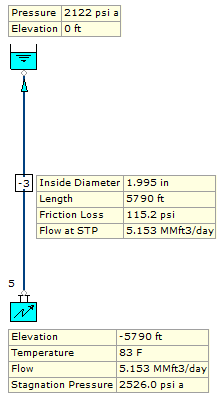
Figure 2: Gas-Distillate Well Pressure Model.
Published literature (1) makes reference to a hand-calculated inlet pressure of 2,556 psia. FluidFlow has established an inlet pressure of 2,526 psia. A plot of the pressure traverse for this vertical system has also been provided (Figure 3).
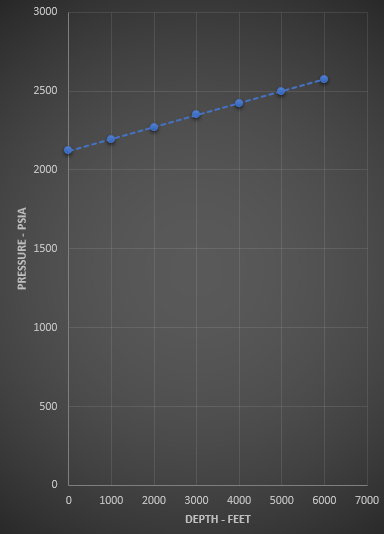
Figure 3: Pressure Traverse of Flowing Gas Well.
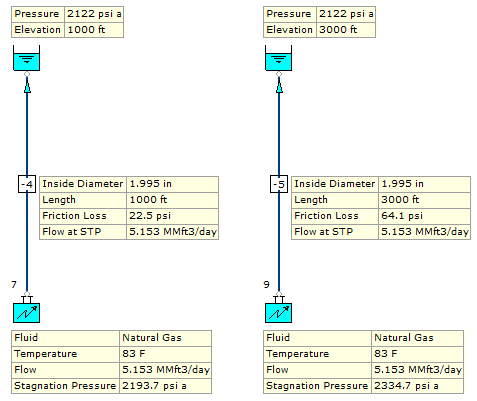
To make a comparison, two further test case scenarios were created in FluidFlow, one with a well depth of 1,000 ft and one at 3,000 ft. Based on the graph plot, the corresponding pressure is approximately 2,195 psia and 2,340 psia. The models for the two cases are outlined in Figure 4.

Figure 4: Gas-Distillate Well Pressure Model (Well Depths of 1,000 ft & 3,000 ft).
The FluidFlow solution has established calculated inlet pressures of 2193.7 and 2334.7 psia respectively. Again, the solution produces good agreement with published literature.
Figure 5 provides an illustration of a natural gas distribution system as modeled using FluidFlow. The system consists of 77,103 ft of pipework ranging from 2 to 18 inches in diameter. The initial condition is 50 barg and 100 oC and all outlets are set to 140 barg. Four compressor stations have been modeled in the system generating a total flow rate of 2,000,000 kg/h. The analysis of this system included optimisation of the plant and an evaluation of the effect of pipe roughness after many years of use.
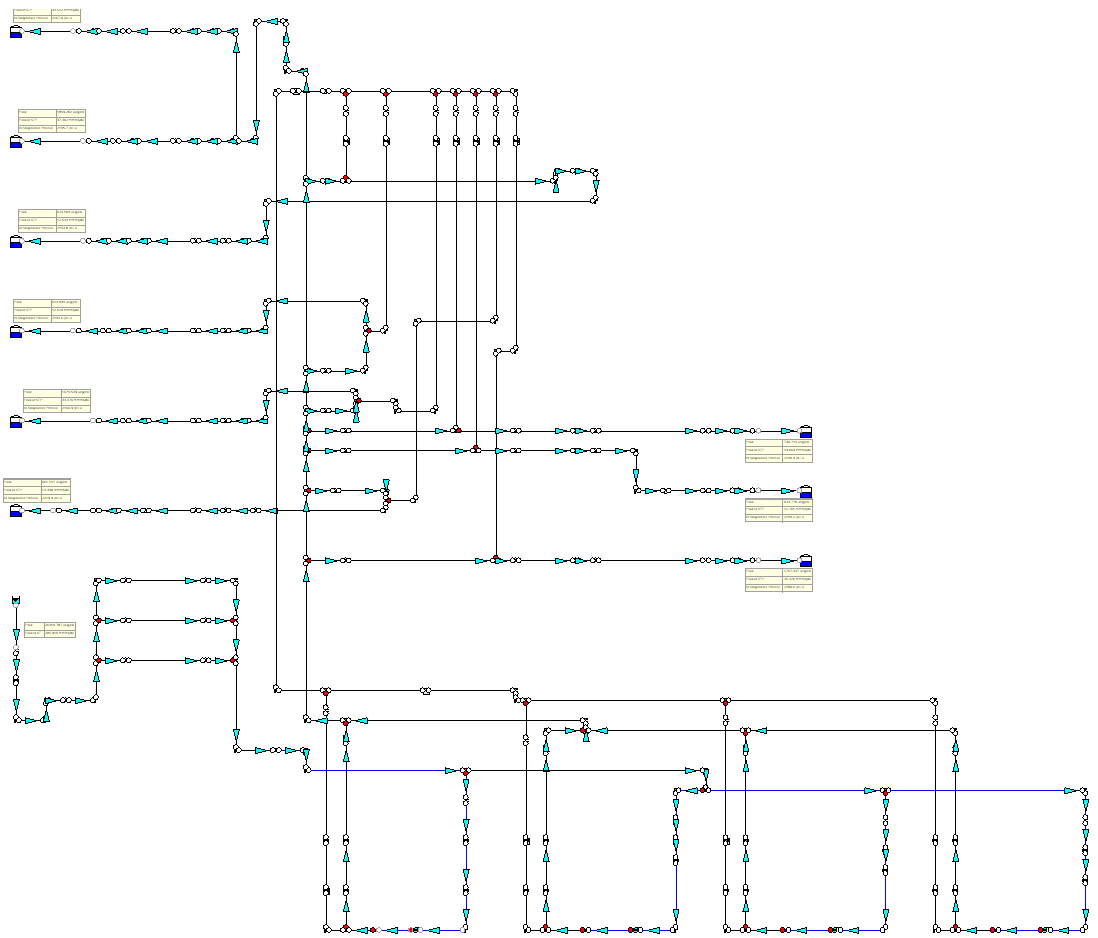
Figure 5: Natural Gas Distribution System.
References:
The Calculation of Pressure drop in the flow of natural Gas through a pipe – Fred H. Poettmann.
To read our previous blog post on Compressible Gas Flow In Pipes; please click here – https://fluidflowinfo.com/gas-flow-in-pipelines/